AUTOMATED DATA ANALYSIS ALGORITHMS
 One of the key benefits of this technology is the fact that data analysis can be performed through the use of automated image/data processing algorithms as opposed to manual review.
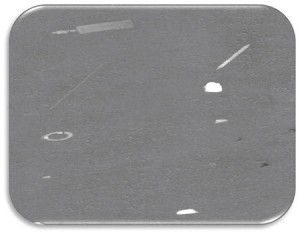
Both Range and Intensity algorithms can be used to detect features/defects of interest. For example, the presence of pavement markings can be detected from intensity images and the presence of FOD or pavement cracking can be detected from range data.
Following automated analysis, results are stored using the open data format; XML, or “Extensible Markup Language” which can be readily imported into all major data formats including spreadsheet programs like Excel as well as various Relational Database technologies such as Microsoft Access and SQL and Oracle. For each detected feature or defect records typically include information such as date and time of detection, location of detection, and physical dimensions.
Results of data analysis can also be overlaid on Intensity, Range or Merged 3D images captured by the system and output as JPEG images to facilitate visualization of the detected feature or defect.
APPLICATIONS OF DATA FOR PAVEMENT MANAGEMENT (AIRPORT OR HIGHWAY)
The LCMS processing library contains an extensive set of algorithms related to pavement condition rating including:
• Longitudinal profile and/or roughness
• Transverse profile and/rutting
• Potholes
• Longitudinal cracking
• Transverse cracking
• Pattern cracking
• Crack and/or joint seal failure
• Concrete slab faulting
• Macro Texture
• Bleeding
• Raveling
From a pavement condition inspection perspective, most features are located in the high-spatial frequency portion of the range data. It shows a two meter wide transverse profile where the general depression of the profile corresponds to the presence of a rut, the sharp drop in the center of the profile corresponds to a crack and the height variations around the red line correspond to the macro-texture of the pavement surface.
These data items can be used to support a full pavement management program for a DOTs/City’s/Airport’s paved surfaces using MicroPAVER™ or other Pavement Management System software applications.
 TrafficInfraTech Magazine Linking People Places & Progress


