
Page 56 - TrafficInfraTech Magazine - Linking People Places & Progres
P. 56
TECHNOLOGY
the impact of COVID-19. We felt this
change would help us in understanding
the travel behaviour after the impact of
COVID-19. When we started compiling,
the results were interesting.
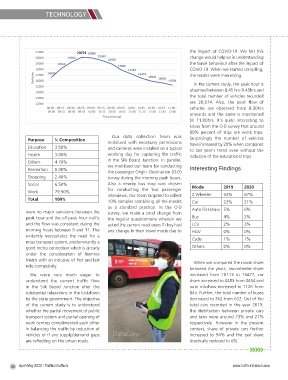
In the current study, the peak hour is
observed between 8:45 hrs- 9:45hrs and
the total number of vehicles recorded
are 20,074. Also, the peak flow of
vehicles are observed from 8:30hrs
onwards and the same is maintained
till 11:00hrs. It’s quite interesting to
know from the O-D survey that around
80% percent of trips are work trips.
Our data collection team was
Purpose % Composition Surprisingly the number of vehicles
mobilized with necessary permissions have increased by 20% when compared
Education 3.50% and cameras were installed on a typical to last year’s trend even without the
Health 3.00% working day for capturing the traffic inclusion of the educational trips.
Others 4.70% in the Silk Board Junction. In parallel,
we mobilised our team for conducting
Recreation 0.00% Interesting Findings
the passenger Origin -Destination (O-D)
Shopping 2.40% survey during the morning peak hours.
Social 6.50% Also a nearby bus stop was chosen Mode 2019 2020
Work 79.90% for conducting the bus passenger
interviews. Our team targeted to collect 2 Wheeler 65% 67%
Total 100%
10% samples combining all the modes Car 22% 21%
as a standard practice. In the O-D
were no major variations between the survey, we made a small change from Auto Rickshaw 5% 6%
peak hour and the off-peak hour traffic the regular questionnaire wherein we Bus 4% 2%
and the flow was consistent during the asked the current road users if they had LCV 2% 3%
morning hours between 9 and 11. This any change in their travel mode due to HGV 0% 0%
evidently necessitates the need for a
mass transport system, predominantly a Cycle 1% 1%
good metro connection which is already Others 0% 0%
under the consideration of Namma
Metro with an inclusive of first and last When we compared the mode share
mile connectivity.
between the years, two-wheeler share
We were very much eager to increased from 10113 to 13477, car
understand the current traffic flow share increased to 4283 from 3454 and
in the Silk Board Junction after the auto rickshaw increased to 1126 from
substantial relaxations in the lockdown 845. Further, the total number of buses
by the state government. The objective decreased to 362 from 632. Out of the
of the current study is to understand total cars recorded in the year 2019,
whether the partial movement of public the distribution between private cars
transport system and partial opening of and taxis were around 73% and 27%
work centres complimented each other respectively. However in the present
in balancing the traffic by reduction of context, share of private cars further
vehicles or if any supply/demand gaps DataCorp increased to 94% and the taxi share
are reflecting on the urban roads. drastically reduced to 6%.
56 April-May 2020 / TrafficInfraTech www.trafficinfratech-com-500653.hostingersite.com